After the minor disappointment of Bitcoin failing to break above the $70,000 level after the recent Trump speech in Nashville, this week I am going to look at what Biyond's quant indicators are saying.
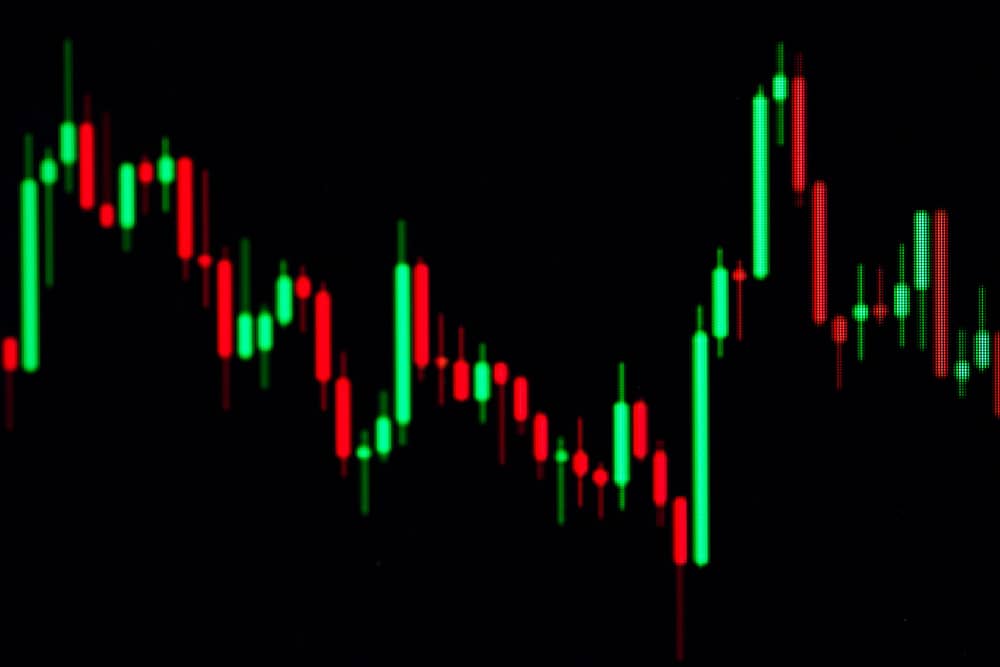
Before I get to this it is worth discussing this weeks price action. Let us not forget Bitcoin has recovered from $63,500 to reach $69,400.

Source: Tradingview.com
So even though Bitcoin has fallen back somewhat today it is still a testament to the strong buying demand Bitcoin is still surrounded by in a bull market.
Personally, I would be keeping a close watch on the $66,000 level next week. Ideally, this support zone holds and Bitcoin can then challenge $70,000.

Source: Biyond.co
Moving on Biyond's indicators and let us start with Biyond Vanguard. This indicator is looking decidedly more bullish, however, the hallowed weekly Green buy signal is still not upon us.
What is encouraging from this admittedly lagging indicator is that Amber-coloured candles have been forming while the price has moved from $53,500 to $69,400.
Historically, the Amber colour is a warning signal. But this current formation usually only happens before an even larger up move. This is evidenced by the sequences in January 2023 ($20,000 to $32,000) and October 2023 ($27,000 to $50,000).

Source: Biyond.co
With this indicator, once we finally get a Green candle buy signal, I think it will be a strong indication that the expected move to $90,000 is finally going to happen.
Next week come to Biyond's Long Vs Short ratio. This indicator is now steeped in Red, which basically means there are now more traders Short Bitcoin than Long.

Source: Biyond.co
This is a great sign that Retail traders could be about to get wrongfooted before an epic upmove happens.
Simply put, what out for a Bitcoin short squeeze.
And finally, we come to Biyond Atlas. This inverse Bitcoin indicator has been slowly drifting lower since the move back above $60,000.
The key to understanding this indicator is watching the 100 mark. Bullish momentum grows while the price is under 100, and vice versa.

Source: Biyond.co
Right now the indicator is poised to move below 100 (bullish) for the first time since mid-April. Again, another great sign.
Going into next week, if we see Vanguard turning Green, the Long Vs Short ratio in Red, and Atlas turning below 100 then it's safe to say we then have three compelling buy and hold signals.


