Quantitative Investment Guide

The Biyond Quantitative Framework is a systematic approach that utilizes AI-powered factor discovery and statistical methods to guide investment decisions, minimizing reliance on subjective judgment or intuition.

250% Over Benchmark

250% Over Benchmark

AI powered models has outperformed Bitcoin by 250% over the past cycle while maintaining low drawdown periods.

Short & Long Term

Short & Long Term

Specific, clear and transparent investment guides for short, medium and long term investors.

3+ Sharpe Ratio

3+ Sharpe Ratio

Transparent and public live track records with detailed fact sheets for multiple crypto assets.

Biyond Indicators

Employing state-of-art machine learning models, Biyond analyzes a wide spectrum of market data to deliver unique trading indicators, simplifying market conditions to support investment decisions.

Vanguard

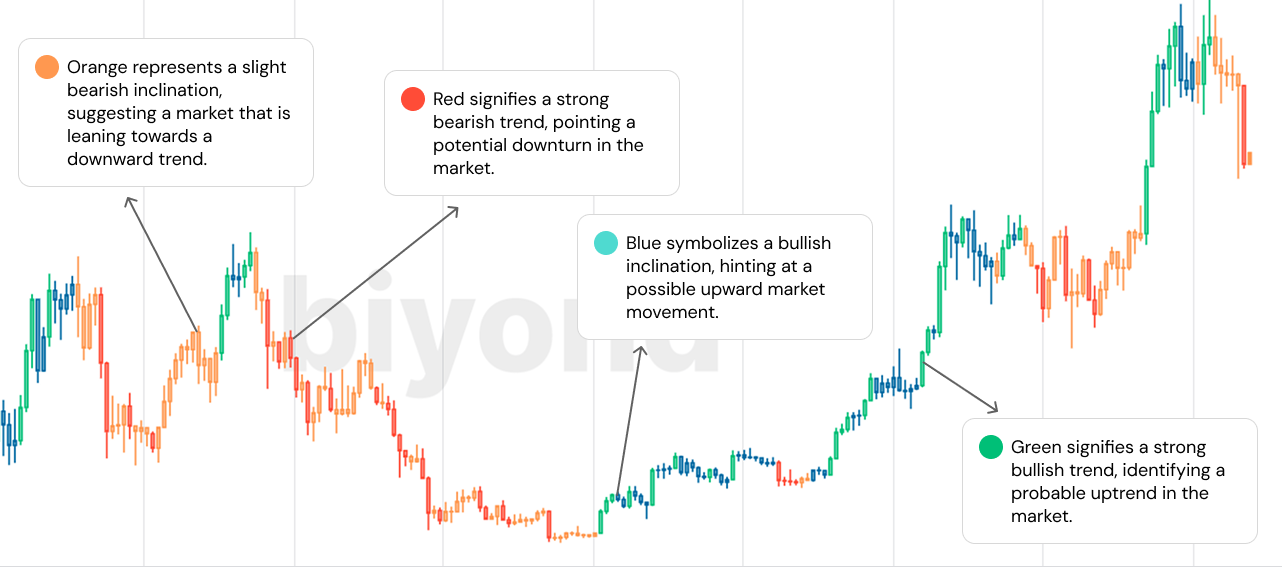
Vanguard offers a cutting-edge trend-based trading system. By leveraging innovative algorithms to interpret price action and momentum, it provides traders with clear insight into market trends across a broad spectrum of cryptocurrencies. Red for strong bearish trends, Orange for bearish inclination, Blue for bullish inclination and Green for strong bullish trends - delivering essential market behavior insights.

Strengths:

  • Provides high conviction for trend following
  • High sharpe ratio ranging from 3 to 6
  • High win rates (~60%)
  • Low drawdown (~20-25% from highest balance)
  • Applicable to low and high timeframes

Weaknesses:

  • Preventive, but not predictive
  • Non-factor based
  • Do not feed from blockchain
Vanguard

Biyond Atlas

Biyond Atlas operates predictively, identifying potential upper and lower price thresholds before market shifts. While indicators like MVRV, The Puell Multiple, Pi Cycle, and Hold Wave signal broader market cycle peaks and troughs, Biyond Atlas more frequently identifies local market conditions. This allows traders to better time the market between these cycle transitions.

Strengths:

  • Frequently predicts overbought and oversold conditions.
  • More frequent than widely used crypto indicators such as 200w MA, MVRV, Hold Waves 
  • Includes blockchain data.
  • Supports discretionary conviction.

Weaknesses:

  • Lower sharp ratio
  • Lags trend changes
  • Long losing trade duration
Biyond Atlas

Firefly Alpha

Firefly Alpha is an indicator that utilizes machine learning to analyze key market factors driving momentum in Bitcoin. By assessing directional movements and quantities, it consolidates complex data into a single, easy-to-understand format. The indicator displays positive values for bullish momentum and negative values for bearish momentum. The larger the value, the stronger the signal.


Even though Firefly Alpha is a great indicator to gauge momentum, it should only be used to confirm discretionary signals. Volatility of crypto assets vary tremendously across different timeframes and even though momentum move in one direction, it should not mean the price action will follow.

Firefly Alpha

Complementary Indicators

Market Score

Market Score integrates all available data sources at Biyond to produce a real-time score reflecting crypto market conditions. A score of 100 indicates extreme bullishness, while a score of 0 indicates extreme bearishness.

Market Score

Session Index

Bitcoin / Altcion Session Index measures the relative performance of 7-day price action comparing Bitcoin and Altcoin markets.

Session Index

Candlestick Patterns

Biyond’s pattern detection tool assists in uncovering hidden market trends and identify vital candlestick patterns across various time frames to enhance trading strategy.

Candlestick Patterns

Fundamental Scores

The Fundamental Score evaluates cryptocurrencies on technical performance, ecosystem health, and economic robustness. Higher scores indicate stronger fundamentals, aiding informed investment decisions.

Fundamental Scores

Technical Indicators and Ranks

Coin ranking across multiple widely used strategies and indicators to make discretionary decisions, updated on a daily basis.

Technical Indicators and Ranks

Quantitative Trading & Investment Guide

Biyond framework uses state-of-art machine learning models and a wide spectrum of market data to create actionable strategies and manage risk for short-term, medium and long-term investors.

Long Term Investors

For long-term investors (over six months) looking to enter crypto markets, it's recommended to track both Biyond Atlas and Vanguard. Avoid long positions when Vanguard's weekly candle is orange or red, and short positions when it's blue or green. Green or red weekly candles from Vanguard have a 60% success rate, suggesting the asset is likely to maintain its momentum. Exit investments when Vanguard's weekly candle turns red to protect assets.

Supplement Vanguard with Biyond Atlas to identify local market tops and bottoms. Avoid long positions when the index is rising in a momentum region, and avoid short positions when it's decreasing in an oversold region. Aligning Vanguard and Biyond Atlas directions improves the ability to manage price volatility and drawdowns. Refer to the fact sheets in the appendix for more details on risks and rewards.

Medium Term Investors

For medium-term investors holding positions for weeks to months, Biyond's three-day Vanguard candles, with a win rate of over 70%, are beneficial. Combining daily and three-day Vanguard candles can further improve trade success and strategy Sharpe ratio, especially when the weekly candle aligns in color.

Exercise caution and avoid positions when Vanguard and Biyond Atlas disagree or when Biyond Atlas is in extreme regions and reversing. Biyond Atlas accurately identifies local market tops and bottoms with over 90% accuracy and a 60% daily signal hit rate.

Short Term Investors

For short-term investors or active traders making multiple trades weekly, Vanguard's 8-hour, 12-hour, and 1-day candles are beneficial, each with a Sharpe ratio close to 1 and a win rate around 66%. Biyond Atlas further supports trade confirmation with its daily signals.

However, Biyond's main models—Biyond Atlas, Firefly Alpha, and Vanguard—are unsuitable for day traders due to lower timeframe strategies' negative Sharpe ratios, despite win rates around 60%. Instead, day traders can use Biyond's supplementary data like Candlestick Patterns, Technical Indicators, and Ranks for practical insights.

Join to review
Biyond Quantitative Framework

Your gateway to insightful crypto investments.