
Biyond Liquidation Tools
A liquidation heatmap with a public track record
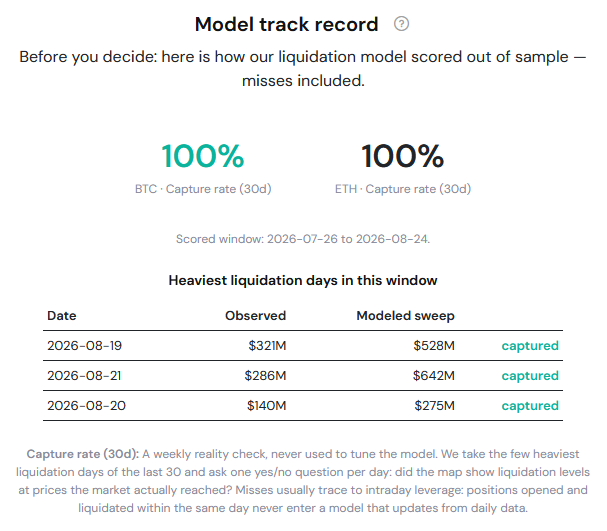
Map the leverage in the market: liquidation levels across four venues, live liquidations streamed from three exchanges, and order-book depth to weigh against them. Every week we publish how much of the heaviest liquidation days our model actually captured — misses included. No other liquidation tool does that.
4
Exchanges mapped — Binance, Bybit, OKX, Hyperliquid
Hourly
Model rebuilds, every coin
Weekly
Published capture rate — misses included
Why traders switch to Biyond
Calibrated, not guessed
Our leverage tiers are fitted to hundreds of thousands of recorded liquidations and scored against what the market went on to do. The sweep-probability model is fitted and validated out-of-sample on every one of the covered coins. Most tools tune a picture; we fit models.

The full liquidation stack
Heatmap, liquidity balance, live multi-exchange liquidations, long/short ratios, venue lifelines, book heatmap and a position calculator — one subscription, no per-tool upsells.

Honest by design
A scorecard on the page shows how much of the heaviest liquidation days the model captured, updated weekly, misses included. When a signal fails our validation gates, we drop it instead of shipping it.
The Liquidation Levels map
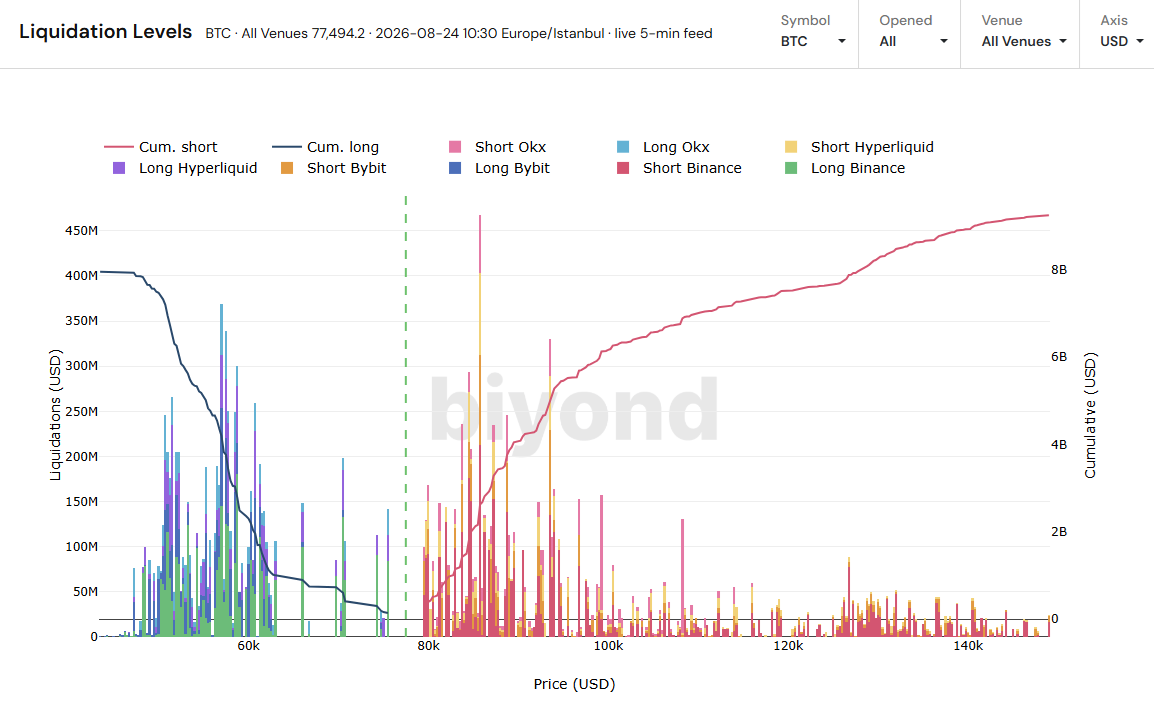
Where leveraged longs and shorts sit, coin by coin and venue by venue — Binance, Bybit, OKX and Hyperliquid. Calibrated leverage tiers, position-age filters that isolate fresh leverage from stale, a multi-coin aggregate view, and automated commentary on every rebuild. Nearby clusters carry a volatility-implied probability of being swept within 7 days — a model we validated out-of-sample on all coins covered before showing you a single number.
Liquidity Balance — fuel against cushion
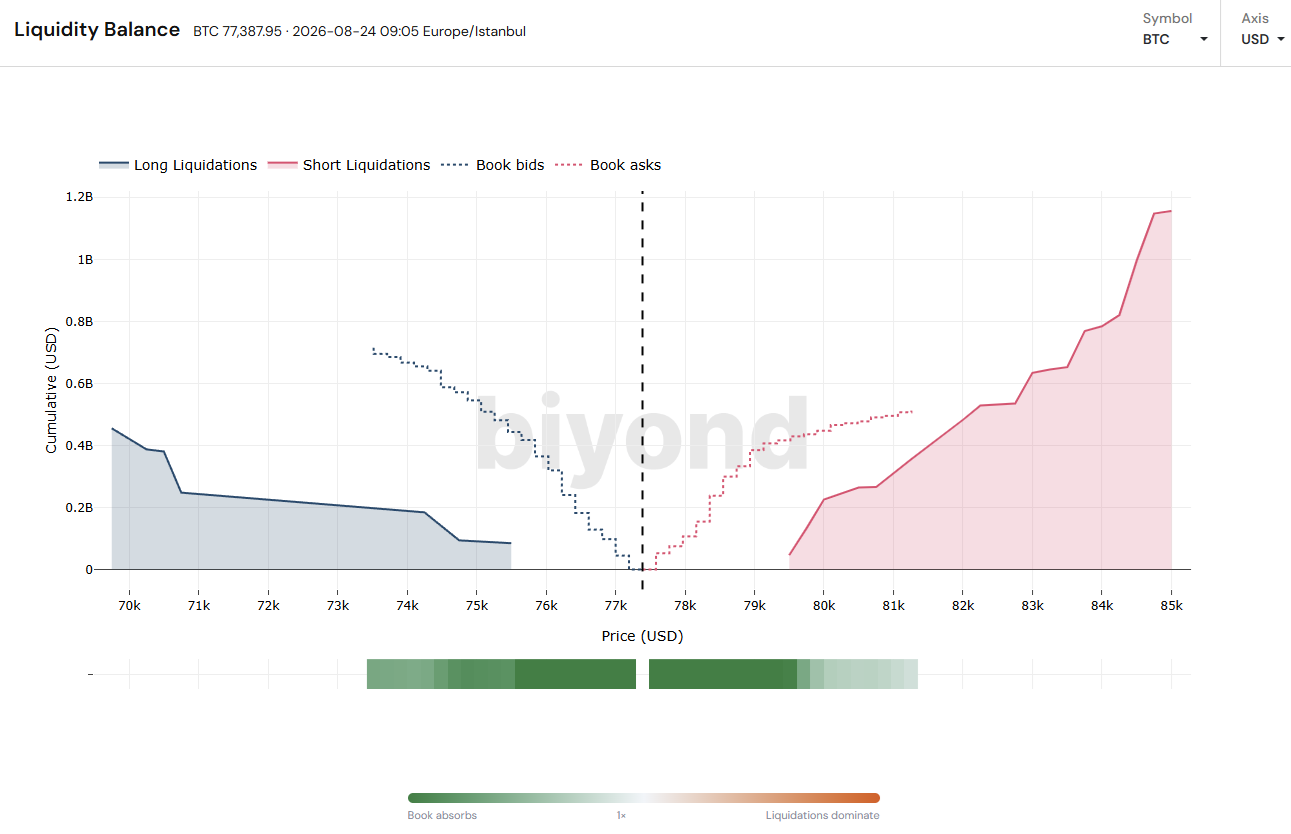
The chart no one else has: forced-liquidation fuel plotted against real order-book depth within ±10% of spot, with a dominance strip that flags where the fuel outweighs the visible cushion — and a history of past "red days" so you can see how those setups resolved. Two data worlds, one picture.
Live liquidations, straight from the exchanges
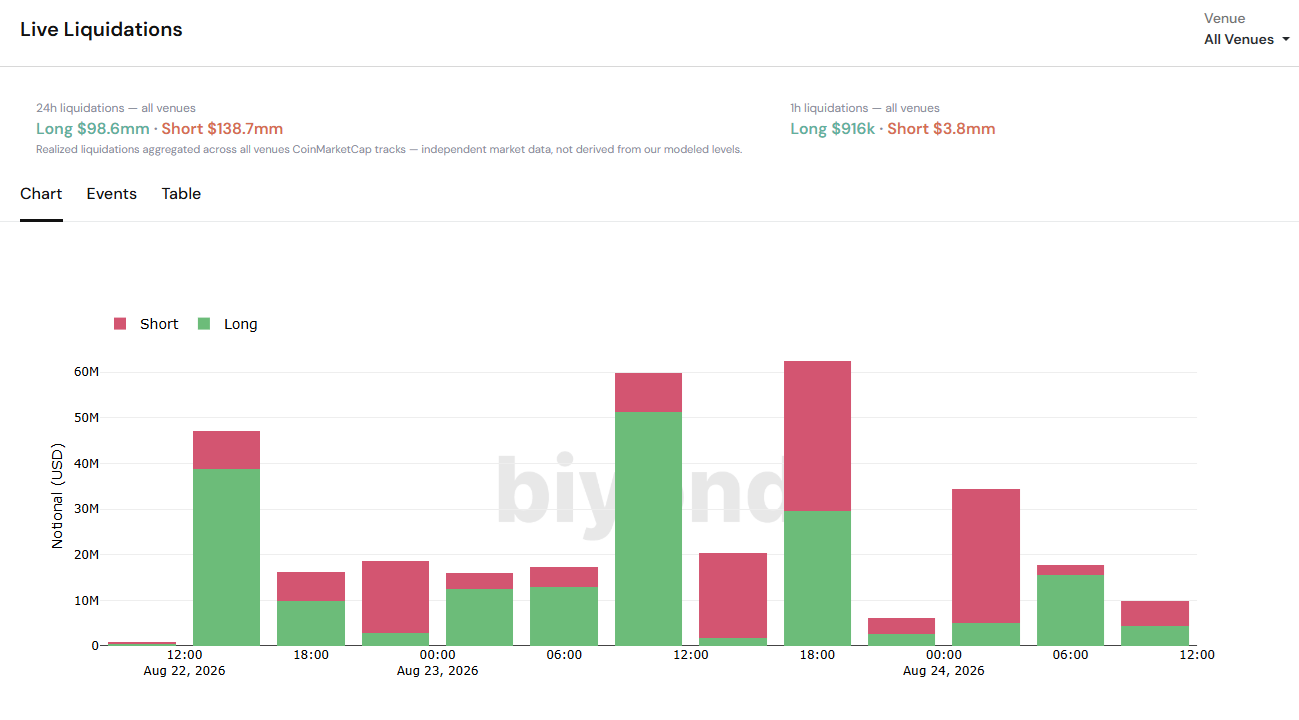
Per-event liquidation streams from Binance, Bybit and OKX — chart, tape and event scatter — plus Hyperliquid open interest tracked hourly. Not an aggregator's delayed feed: our own recorders, on the exchange websockets.
The scorecard is on the page
Every week we score the model against the heaviest observed liquidation days on BTC and ETH and publish the capture rate right on the chart, with the measurement window labeled. It's a reality check, never used to tune the model — and when the model misses, the number says so. We think that's the only honest way to sell one.
Free tools included
The live long/short ratio, the liquidation calculator, the ratios table and the book heatmap are free for every account — and free users also see the map and the feed with a 7-day lag, plus the model's public scorecard. Judge it before you pay for it.
Compare plans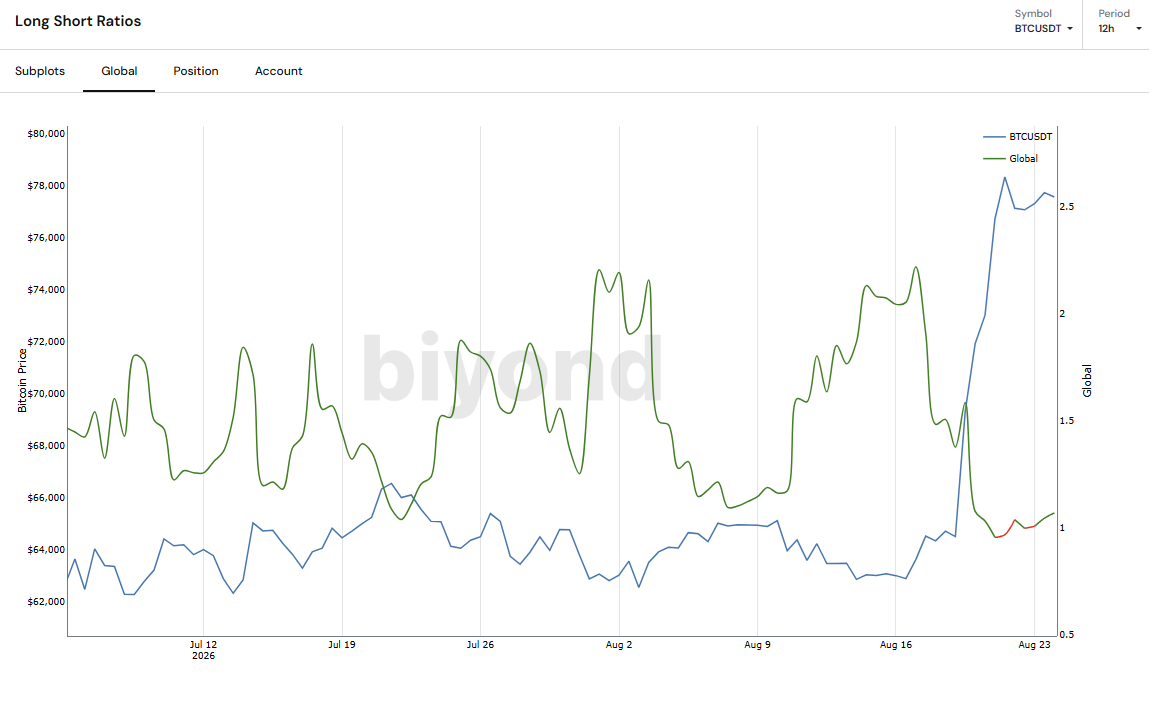
How Biyond compares
An honest comparison — including the rows where competitors are ahead. Where a competitor's methodology or coverage isn't publicly documented, we say "not disclosed" rather than guess.
|
Biyond
from $39/mo
Start free
|
KingFisher
from $79/mo
|
Hyblock
from $99/mo
|
|
|---|---|---|---|
Liquidation heatmap
Exchange-data-driven map of estimated liquidation levels
|
|||
Coins on the map
We list fewer coins on purpose — every one passes data-quality gates (≥1 year of positioning history, live feeds)
|
44 | 180+ (Pro) | ~680 |
Per-venue liquidation maps
Separate maps for Binance, Bybit, OKX and Hyperliquid
|
$109 tier | ||
Model calibrated to observed liquidations
Leverage tiers fitted to recorded liquidation events
|
Not disclosed | Not disclosed | |
Model accuracy published
Weekly capture rate on the page, misses included, window labeled
|
|||
Liquidations vs order-book balance
Forced-flow fuel against visible book depth on one chart
|
|||
Live multi-exchange liquidation feed
Per-event streams from Binance, Bybit, OKX
|
Not disclosed | ||
Options analytics included
GEX, futures curve and options matrix in the same plan
|
GEX only | ||
Alerts / API / bots
Biyond alerts deliver to Discord on the Pro plan
|
Discord (Pro) | API from $499/mo | API on $499/mo tier |
Free tier |
Live ratio + calculator, map with 7-day lag, public scorecard | BTC only, 24h delay | No liquidation levels |
Entry price with liquidation maps |
$39/mo | $79/mo | $99/mo |
Competitor prices and feature scope as published on their own sites and apps, last verified August 2026. Spot something out of date? Tell us and we'll correct it — honesty is the product.
Where we're honest about the gaps
A comparison page that only lists wins is an ad. These are the trade-offs we've made and what we're doing about them.
Fewer coins, on purpose
44 coins versus competitors' hundreds. Every coin on our map passes hard data-quality gates; a heatmap on thin data is decoration. The universe grows as coins qualify.
Calibration deepest on BTC & ETH
Leverage tiers are fitted directly on BTC and ETH liquidation history; other coins inherit those tiers until they earn their own at the quarterly recalibration. The per-coin sweep-probability model already covers all 44 — and the published scorecard grades BTC and ETH.
Order-book depth is Binance-first
Our liquidation maps and feed are multi-venue, but book depth and the Liquidity Balance run on Binance, crypto's deepest order book. Multi-venue book aggregation is on the roadmap.
No public API yet
Alerts now deliver to Discord on the Pro plan — liquidation-level alerts are next in line, held behind our validation gates until they earn their way out. A model-output API is planned.
Every liquidation tool, one plan
The full liquidation stack ships in the Biyond Basic plan at $39/month ($374/year) — alongside quantitative indicators, options analytics and daily market analysis. No per-tool add-ons, no "heatmap tier". Free accounts get the live long/short ratio, calculator, ratios and book heatmap, the map with a 7-day lag, and the model's public scorecard before you pay a cent.
Frequently Asked Questions
Biyond's liquidation tools are data and analytics products. Liquidation levels are model-based estimates derived from exchange data; they are not investment advice, price predictions or a solicitation to trade. Past model performance, including published capture rates, does not guarantee future results.
Judge the map by its record
Open a free account, see the scorecard, watch it for a week — then decide.

Biyond Trader LLC is strictly a research publishing firm. We do not provide individual investment advice. This service is not registered with any financial regulatory agency such as the FSA in the UK or NASD, SEC, or NYSE in the US. The information we publish is educational only and based on our opinions plus our quantitative models, statistical and financial data and independent research. By using our services you acknowledge that we do not provide personalized recommendations or advice. Alternative asset classes are volatile investments and carry significant risk. Consult your financial advisor before making financial decisions.